- A+
- A-
- A

National Biomass Atlas of India
Click on the state for detailed information
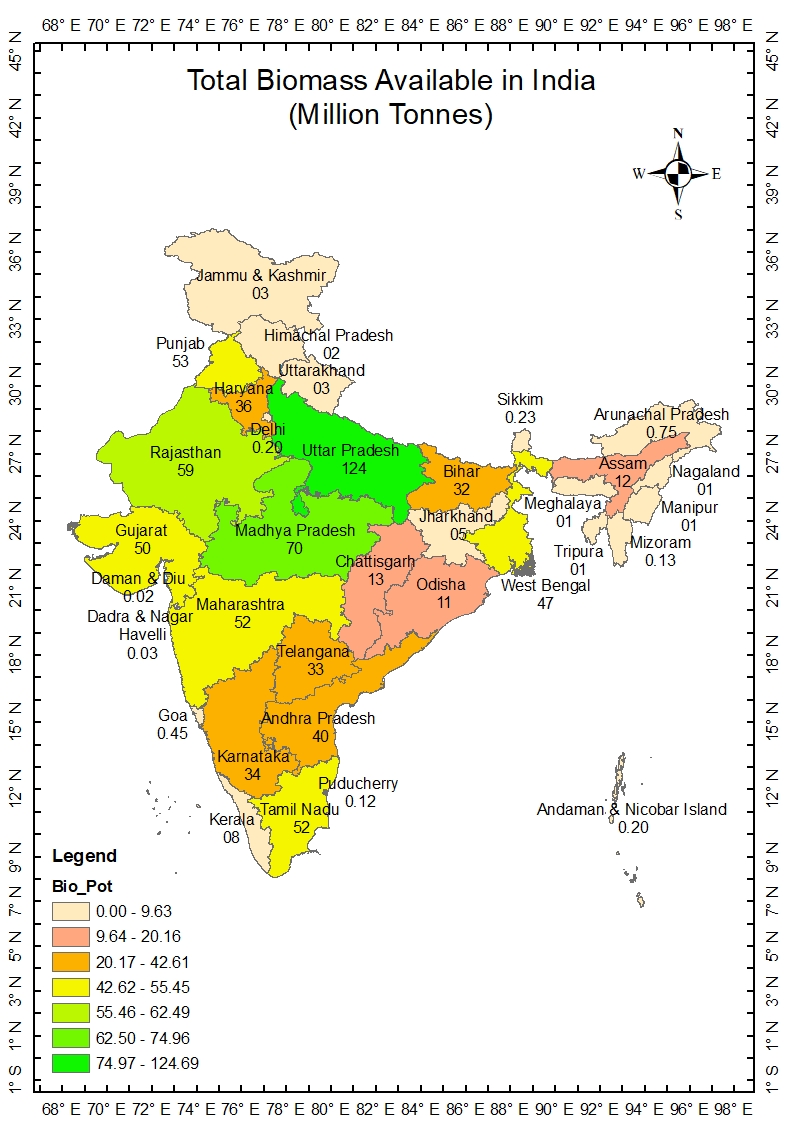
Total Biomass Available (thousand tonnes) in India
| States | Wheat | Rice | Maize | Bajra | Sugarcane | Groundnut | Rapeseed Mustard |
Arhar/Tur | Total Crops |
|---|---|---|---|---|---|---|---|---|---|
| Andaman & Nicobar | -- | 19.7 | 1.0 | -- | 0.1 | -- | -- | -- | 201.0 |
| Andhra Pradesh | 0.1 | 14407.0 | 4248.0 | 164.0 | 394.0 | 1619.0 | 3.0 | 278.0 | 40012.0 |
| Arunachal Pradesh | 14.2 | 322.0 | -- | -- | 2.1 | -- | -- | -- | 751.0 |
| Assam | 43.6 | 7768.0 | 212.5 | -- | 56.5 | -- | 344.6 | 14.2 | 12571.0 |
| Bihar | 10096.0 | 11571.6 | 7289.0 | 12.0 | 646.6 | 1.7 | 174.0 | 93.0 | 32572.0 |
| Chandigarh | 4.6 | 0.1 | 0.1 | -- | -- | -- | -- | -- | 5.0 |
| Chhattisgarh | 268.0 | 10962.0 | 599.5 | 0.2 | 3.9 | 95.8 | 41.4 | 97.8 | 12990.0 |
| Dadra & Nagar Haveli, and Daman &Diu |
0.6 | 41.5 | 0.2 | 1.6 | 2.6 | -- | -- | 4.5 | 53.3 |
| Goa | -- | 157.5 | -- | -- | 2.0 | 6.5 | -- | -- | 451.7 |
| Gujarat | 4904.8 | 2785.1 | 1659.0 | 2421.8 | 555.9 | 6878.0 | 618.4 | 945.5 | 50235.7 |
| Haryana | 20024.4 | 5985.5 | 57.5 | 2025.1 | 371.7 | 8.1 | 1518.3 | 26.5 | 36238.6 |
| Himachal Pradesh | 922.3 | 166.5 | 1459.0 | 0.2 | 2.0 | 0.1 | 6.4 | -- | 2743.3 |
| Jammu & Kashmir | 1040.2 | 865.9 | 1221.2 | 16.5 | -- | -- | 56.2 | -- | 3240.2 |
| Jharkhand | 340.4 | 3479.3 | 753.3 | -- | -- | -- | 68.2 | 343.3 | 5311.0 |
| Karnataka | 311.7 | 4413.0 | 9381.0 | 644.3 | 1630.5 | 1111.6 | 1.0 | 2140.6 | 34093.6 |
| Kerala | -- | 739.3 | 0.1 | -- | 0.6 | 1.1 | -- | 3.8 | 8584.1 |
| Madhya Pradesh | 31555.6 | 5131.5 | 5316.4 | 1319.4 | 187.8 | 756.5 | 1168.6 | 1298.8 | 70233.1 |
| Maharashtra | 3048.1 | 4456.0 | 6231.7 | 1579.7 | 3433.8 | 843.1 | 6.0 | -- | 52540.1 |
| Manipur | 10.0 | 803.9 | 135.5 | -- | 17.1 | 6.5 | 42.4 | 1.4 | 1143.8 |
| Meghalaya | 1.6 | 455.1 | 95.4 | -- | -- | -- | 16.7 | 4.2 | 1373.3 |
| Mizoram | -- | 92.6 | 22.1 | -- | 2.4 | --- | 1.1 | 0.9 | 134.1 |
| Nagaland | 9.1 | 684.0 | 319.3 | 1.8 | 21.3 | 2.3 | 48.9 | 13.4 | 1377.6 |
| Odisha | 0.4 | 11110.3 | 332.4 | -- | 1.9 | 114.4 | 4.6 | -- | 11839.2 |
| Puducherry | -- | 76.0 | -- | 0.1 | 10.1 | 1.9 | -- | 1.0 | 122.6 |
| Punjab | 30925.8 | 18921.5 | 1013.1 | -- | 366.2 | 5.6 | 81.4 | 12.1 | 53003.9 |
| Rajasthan | 20609.2 | 636.7 | 3315.4 | 9767.5 | 25.5 | 2656.3 | 6359.4 | 36.2 | 59504.1 |
| Sikkim | 0.7 | 29.6 | 157.3 | -- | -- | -- | -- | -- | 228.6 |
| Tamil Nadu | -- | 18154.3 | 10620.2 | 711.0 | 1027.5 | 1908.6 | 0.2 | 254.3 | 52141.3 |
| Telangana | 23.9 | 10835.7 | 7834.7 | 51.2 | 183.7 | 1033.7 | 5.1 | 734.6 | 33623.6 |
| Tripura | 0.6 | 1345.8 | 21.5 | -- | 2.2 | 2.4 | 7.3 | 7.0 | 1413.3 |
| Uttar Pradesh | 65194.1 | 23005.1 | 3571.3 | 4656.6 | 8561.7 | 210.9 | 1751.9 | 903.6 | 124692.8 |
| Uttarakhand | 1639.4 | 977.4 | 91.4 | -- | 295.8 | 2.7 | 20.4 | 7.8 | 3552.2 |
| West Bengal | 1348.7 | 24139.1 | 3780.2 | 0.1 | 81.5 | 443.5 | 1233.0 | 11.6 | 47506.4 |
| Total | 192338.9 | 184538.8 | 69739.4 | 23481.3 | 17887.1 | 17710.2 | 13879.7 | 7234.3 | 754484.9 |
Note:Total includes–Arhar/Tur, Bajra, Banana, Barley, Coriander, Cowpea (Lobia), Dry chillies, Garlic ,Ginger, Gram, Groundnut, Guar seed, Jowar, Jute, Linseed, Maize, Masoor, Mesta, Moong (Green Gram), Moth, Onion, Other Kharif pulses, Other oil seeds, Peas & beans (Pulses), Potato, Ragi, Rapeseed & Mustard, Rice, Sesamum, Small millets, Soyabean, Sugarcane, Sunflower, Sweet potato, Tobacco, Turmeric, Urad, Wheat.
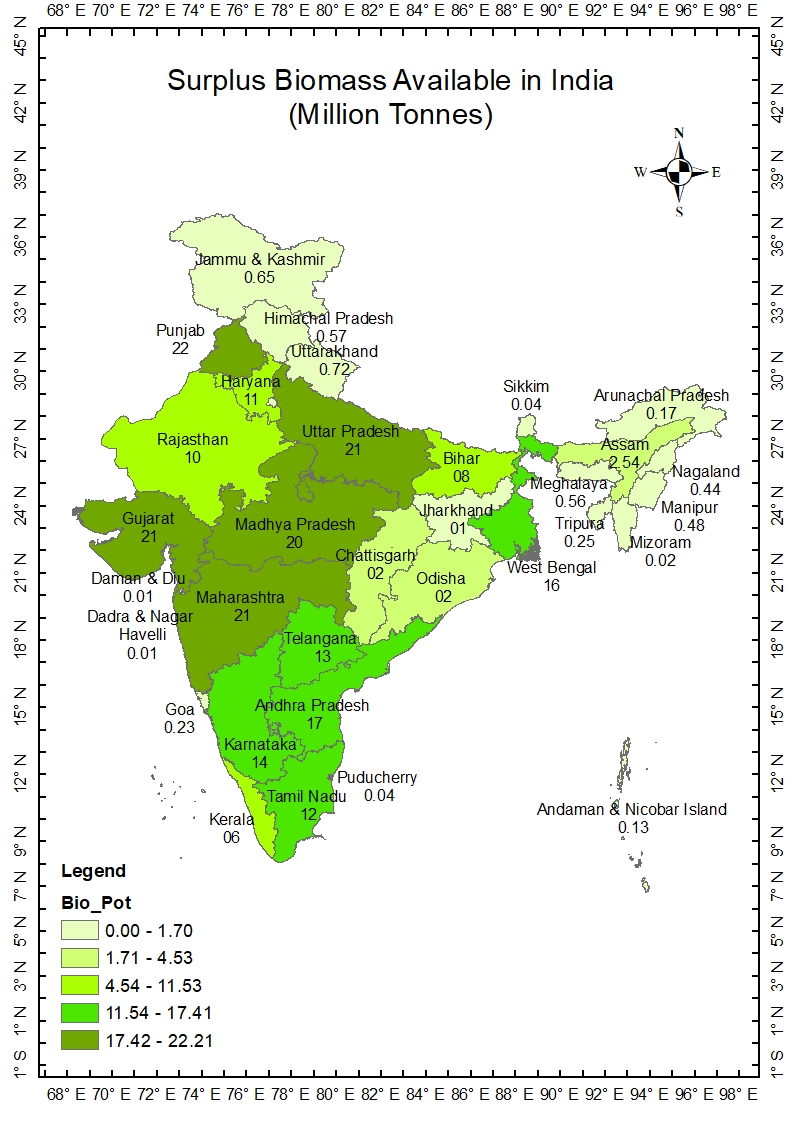
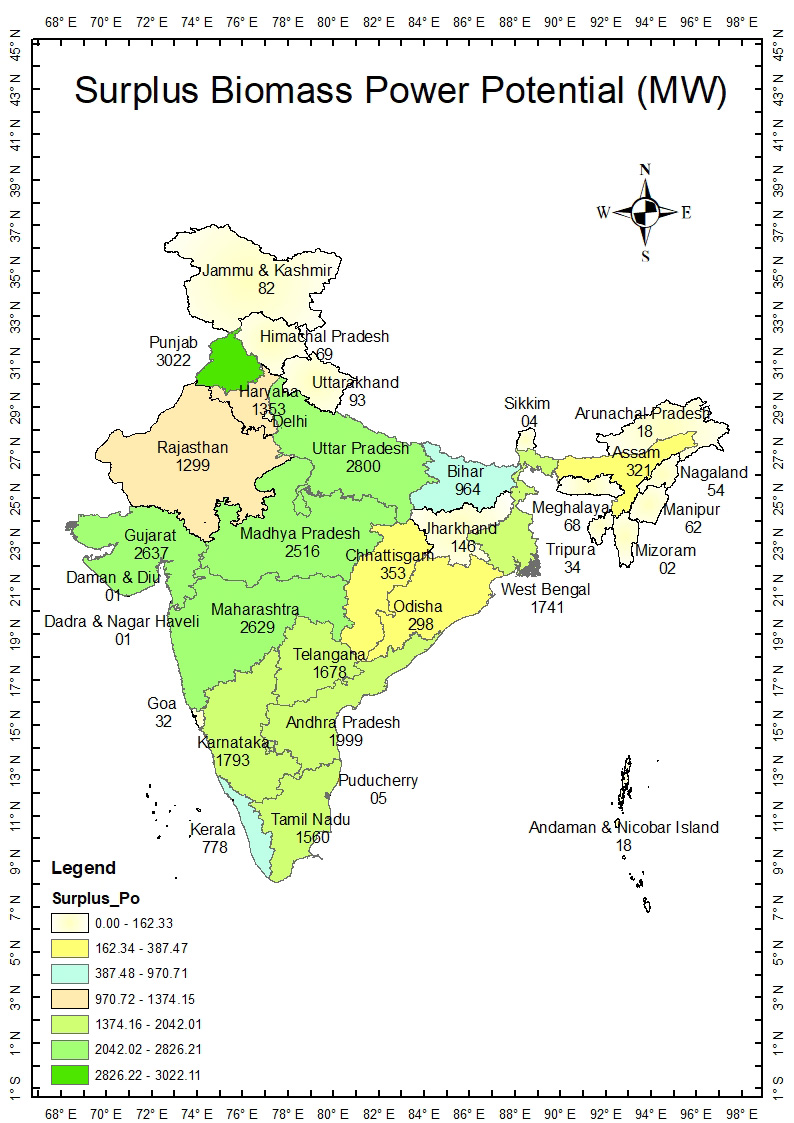
Surplus Biomass Residue (Thousand Tonnes) in India
| States | Rice | Wheat | Maize | Sugarcane | Arhar/Tur | Bajra | Rapeseed Mustard |
Groundnut | Total | Power Potential (MW) |
|---|---|---|---|---|---|---|---|---|---|---|
| Andaman & Nicobar | 3.3 | -- | 0.2 | -- | -- | -- | -- | -- | 131.7 | 18.1 |
| Andhra Pradesh | 2571.0 | -- | 2389.0 | 394.0 | 195.0 | 31.0 | 1.5 | 194.0 | 17093.0 | 1999.5 |
| Arunachal Pradesh | 14.0 | 2.8 | 20.2 | 0.5 | -- | -- | -- | -- | 173.8 | 18.5 |
| Assam | 650.58 | 8.71 | 42.5 | 14.12 | 9.92 | -- | 172.29 | -- | 2541.0 | 321.9 |
| Bihar | 1106.7 | 2019.2 | 1860.6 | 570.6 | 65.1 | 2.3 | 87.2 | 0.3 | 7983.9 | 964.4 |
| Chandigarh | 0.1 | 0.9 | -- | -- | -- | -- | -- | -- | 1.11 | 0.1 |
| Chhattisgarh | 2189.5 | 53.6 | 86.9 | 1.0 | 68.4 | 0.1 | 20.7 | 19.2 | 2651.8 | 353.7 |
| Dadra & Nagar Haveli, and Daman &Diu | 7.06 | 0.11 | 0.45 | 0.66 | 3.14 | 0.3 | -- | -- | 12.16 | 1.6 |
| Goa | 26.78 | -- | -- | 0.51 | -- | -- | -- | 1.3 | 231.4 | 33.0 |
| Gujarat | 111.4 | 981.0 | 116.1 | 155.7 | 671.3 | 460.1 | 327.7 | 344.0 | 21740.3 | 2637.8 |
| Haryana | 3002.7 | 2002.4 | 11.5 | 92.9 | 18.5 | 383.3 | 759.2 | 1.6 | 10907.5 | 1353.3 |
| Himachal Pradesh | 28.3 | 184.5 | 291.8 | 0.5 | -- | -- | 3.2 | -- | 572.2 | 69.7 |
| Jammu & Kashmir | 147.2 | 208.0 | 244.2 | -- | -- | 3.1 | 28.1 | -- | 652.3 | 82.8 |
| Jharkhand | 347.9 | 68.1 | 346.5 | -- | 240.3 | -- | 47.7 | -- | 1201.8 | 146.3 |
| Karnataka | 750.2 | 62.3 | 1876.2 | 1524.5 | 1498.4 | 93.6 | 0.5 | 222.3 | 14048.5 | 1793.9 |
| Kerala | 175.9 | -- | -- | 0.1 | 2.7 | -- | -- | 0.2 | 6042.1 | 778.4 |
| Madhya Pradesh | 1940.8 | 6311.1 | 2152.3 | 46.9 | 909.2 | 249.7 | 584.3 | 151.3 | 19928.3 | 2516.4 |
| Maharashtra | 43.1 | 609.6 | 38.9 | 858.4 | -- | 299.0 | 3.0 | 108.4 | 21493.8 | 2629.5 |
| Manipur | 352.1 | 2.0 | 27.1 | 2.3 | 1.0 | -- | 21.2 | 1.3 | 484.9 | 62.3 |
| Meghalaya | 25.7 | 0.3 | 19.1 | -- | 3.0 | -- | 8.4 | -- | 561.3 | 68.5 |
| Mizoram | 11.3 | -- | 4.4 | 0.6 | 0.6 | -- | 0.4 | -- | 22.9 | 2.9 |
| Nagaland | 203.5 | 1.8 | 63.9 | 5.3 | 9.4 | 0.3 | 24.5 | 0.5 | 438.3 | 54.1 |
| Odisha | 2007.3 | 0.1 | 66.5 | 0.5 | -- | -- | 2.3 | 22.9 | 2227.6 | 298.7 |
| Puducherry | 12.9 | -- | -- | 2.5 | 0.7 | -- | -- | 0.4 | 37.8 | 5.0 |
| Punjab | 18786.3 | 3092.6 | 202.6 | 91.5 | 8.4 | -- | 40.7 | 1.1 | 22251.0 | 3022.1 |
| Rajasthan | 108.2 | 4121.8 | 25.3 | 6.4 | 16.9 | 1709.3 | -- | 239.1 | 10211.0 | 1299.5 |
| Sikkim | 0.2 | 0.1 | 31.5 | -- | -- | -- | -- | -- | 40.0 | 4.7 |
| Tamil Nadu | 3086.2 | -- | 2124.0 | 256.9 | 178.0 | 134.6 | 0.1 | -- | 12217.4 | 1560.1 |
| Telangana | 1368.7 | 4.8 | 2350.4 | 45.9 | 202.0 | 9.7 | 2.5 | 103.4 | 13761.6 | 1678.4 |
| Tripura | 228.8 | 0.1 | 4.3 | 0.5 | 4.8 | -- | 3.7 | 0.5 | 254.9 | 34.3 |
| Uttar Pradesh | 1035.2 | 13038.8 | 35.7 | 2211.8 | 778.7 | 465.7 | 875.9 | 42.2 | 21600.7 | 2800.3 |
| Uttarakhand | 158.3 | 327.9 | 18.3 | 73.9 | 5.5 | -- | 10.2 | 0.5 | 723.3 | 93.3 |
| West Bengal | 1225.2 | 269.7 | 756.0 | 20.4 | 8.1 | -- | 616.5 | 88.7 | 16277.3 | 1741.7 |
| Total | 41726.9 | 33372.5 | 15206.7 | 6379.1 | 4899.2 | 3842.2 | 3641.8 | 1543.1 | 228516.9 | 28445.5 |
Note:Total includes –Arhar/Tur, Bajra, Banana, Barley, Coriander, Cowpea (Lobia), Dry chillies, Garlic, Ginger, Gram, Groundnut, Guar seed, Jowar, Jute, Linseed, Maize, Masoor, Mesta, Moong (Green Gram), Moth, Onion, Other Kharif pulses, Other oil seeds, Peas & beans (Pulses), Potato, Ragi, Rapeseed & Mustard, Rice, Sesamum, Small millets, Soyabean, Sugarcane, Sunflower, Sweet potato, Tobacco, Turmeric, Urad, Wheat.
** The surplus biomass is available in 1000 tons per year.